Evra
Making ML-driven property valuations legible — by linking every number to the spatial evidence underneath it.
- Geophy
- Lead Product Designer
- 2021
Context
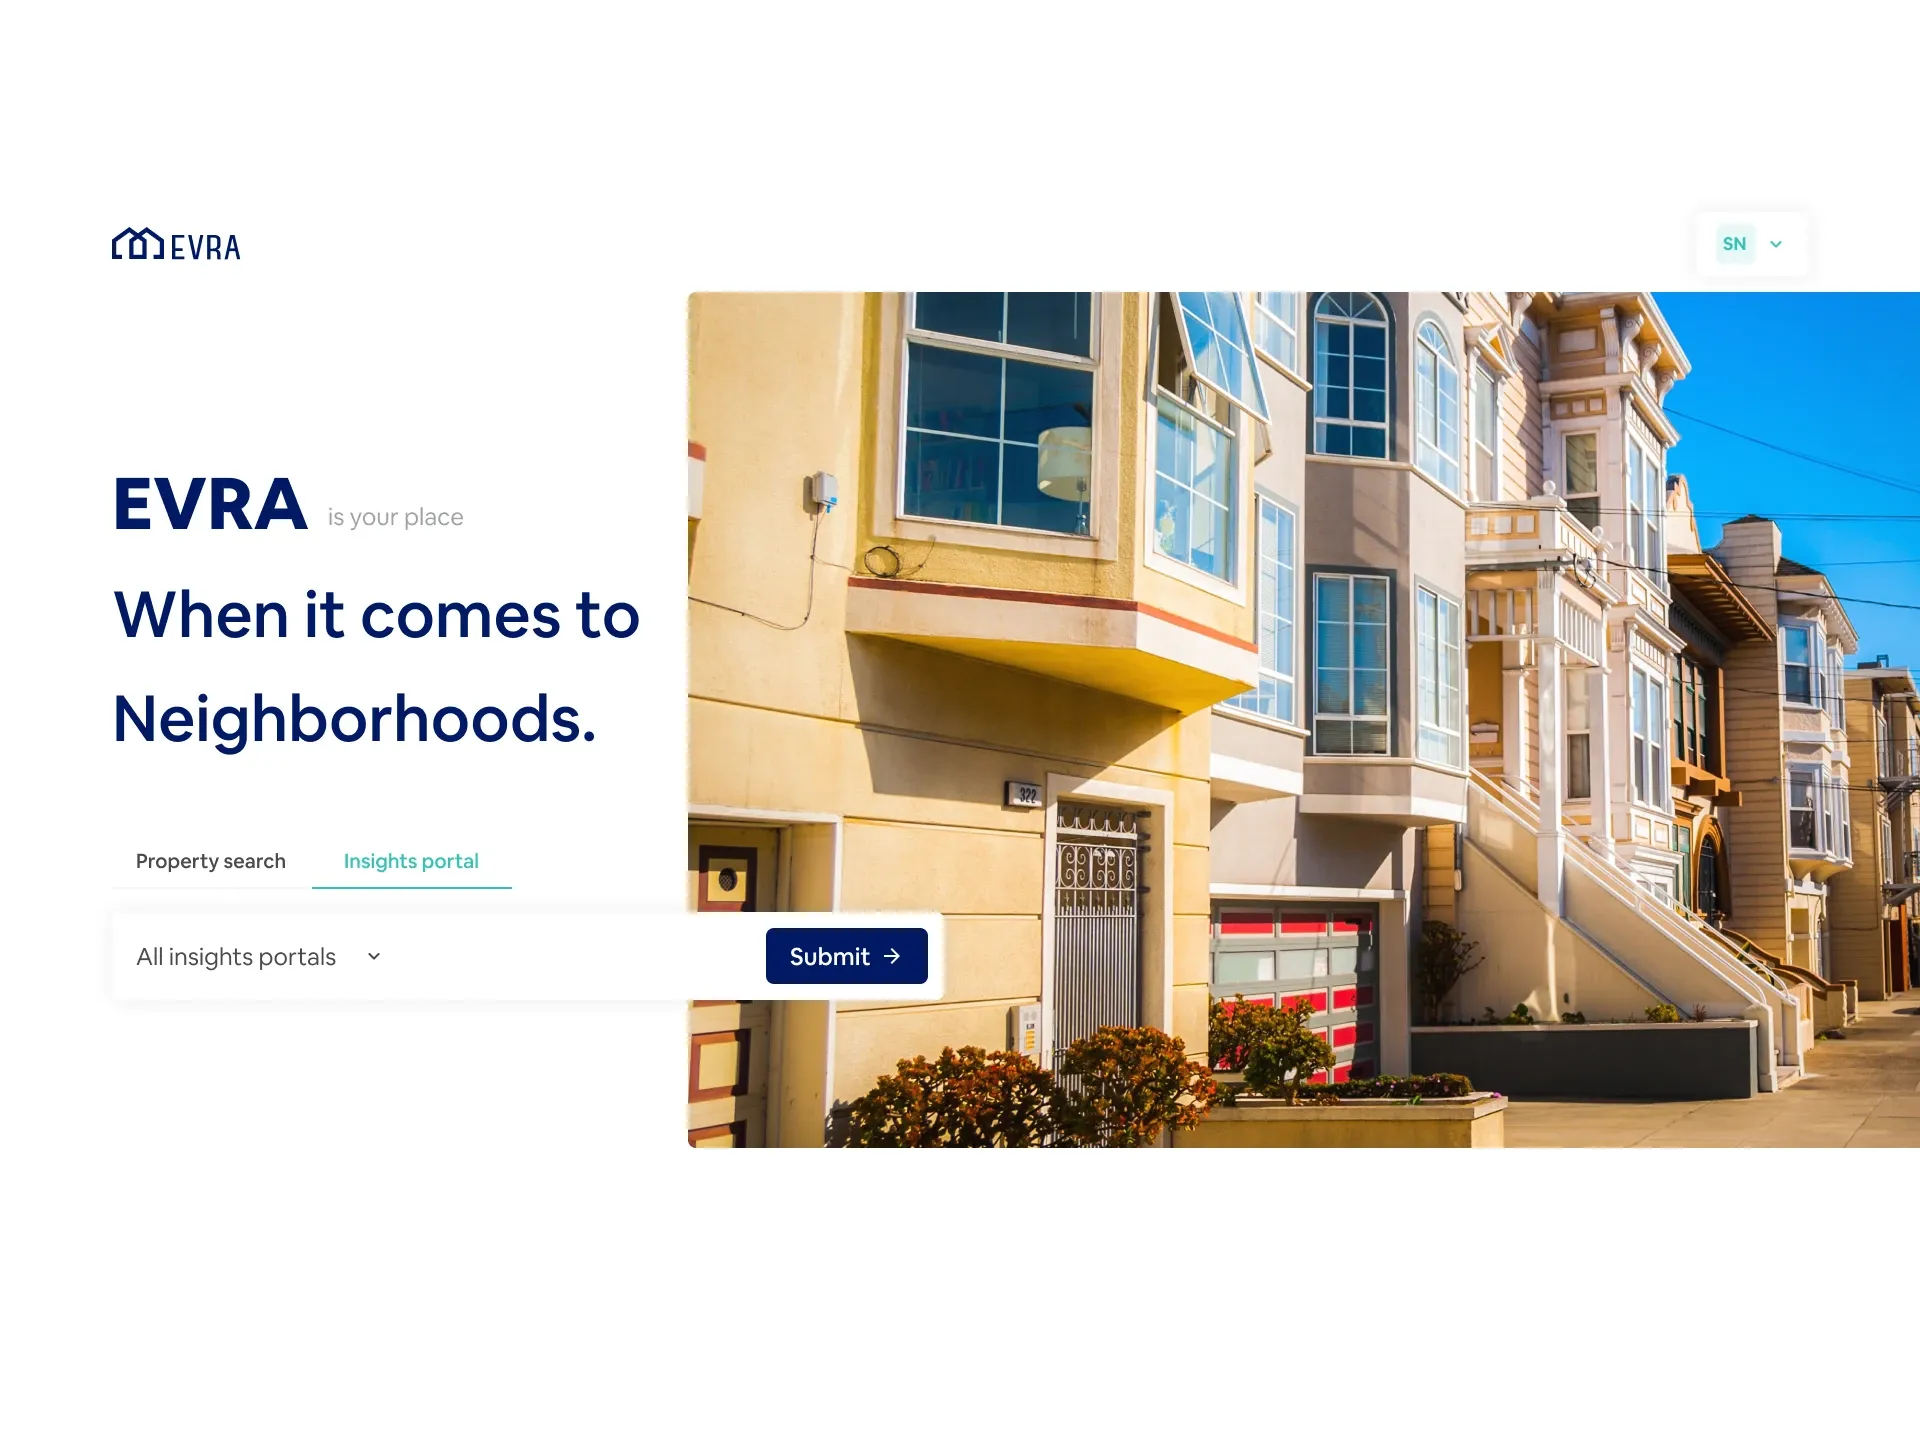
Evra was Geophy’s real-time commercial real estate valuation platform — the underwriting surface in a Dutch proptech stack that also included Apprise (appraisals) and Droost (reports), all running on Geophy’s Delphi data layer. Underwriters used Evra to evaluate multifamily deals: pull a property by address, see the ML-generated valuation alongside neighborhood, benchmarks, sales comps, and tenant credit, and decide whether the deal was worth underwriting.
I joined as Lead Product Designer in 2021 and led design on Evra’s core flows — Property Due Diligence, the Property Map, and the information architecture beneath both. I also contributed to Apprise, Evra’s sibling product covering the appraisals stage.
Research and discovery
The brief came with a hidden complication. Every underwriter we spoke to weighted signals differently. Some led with neighborhood character — was this a market they wanted exposure in? Others led with valuation and cap rate — did the numbers pencil? A third group looked at tenant credit first — who was paying the rent, and how reliably? The same property, evaluated by three underwriters, produced three different reading orders.
A single fixed dashboard couldn’t serve all of them well. One reading order would feel right; the others would feel buried.
We ran discovery in two halves — a problem phase and a solution phase — structured around a methodology principle the team agreed to up front: we often jump to solutions before fully understanding the problem. The problem half covered stakeholder interviews to anchor business objectives, competitor analysis across the existing CRE underwriting toolset, and structured underwriter interviews focused on four questions: who they were, what they needed, why they needed it, and the context they used it in. The output was a multi-persona model that made the variance in decision styles explicit.
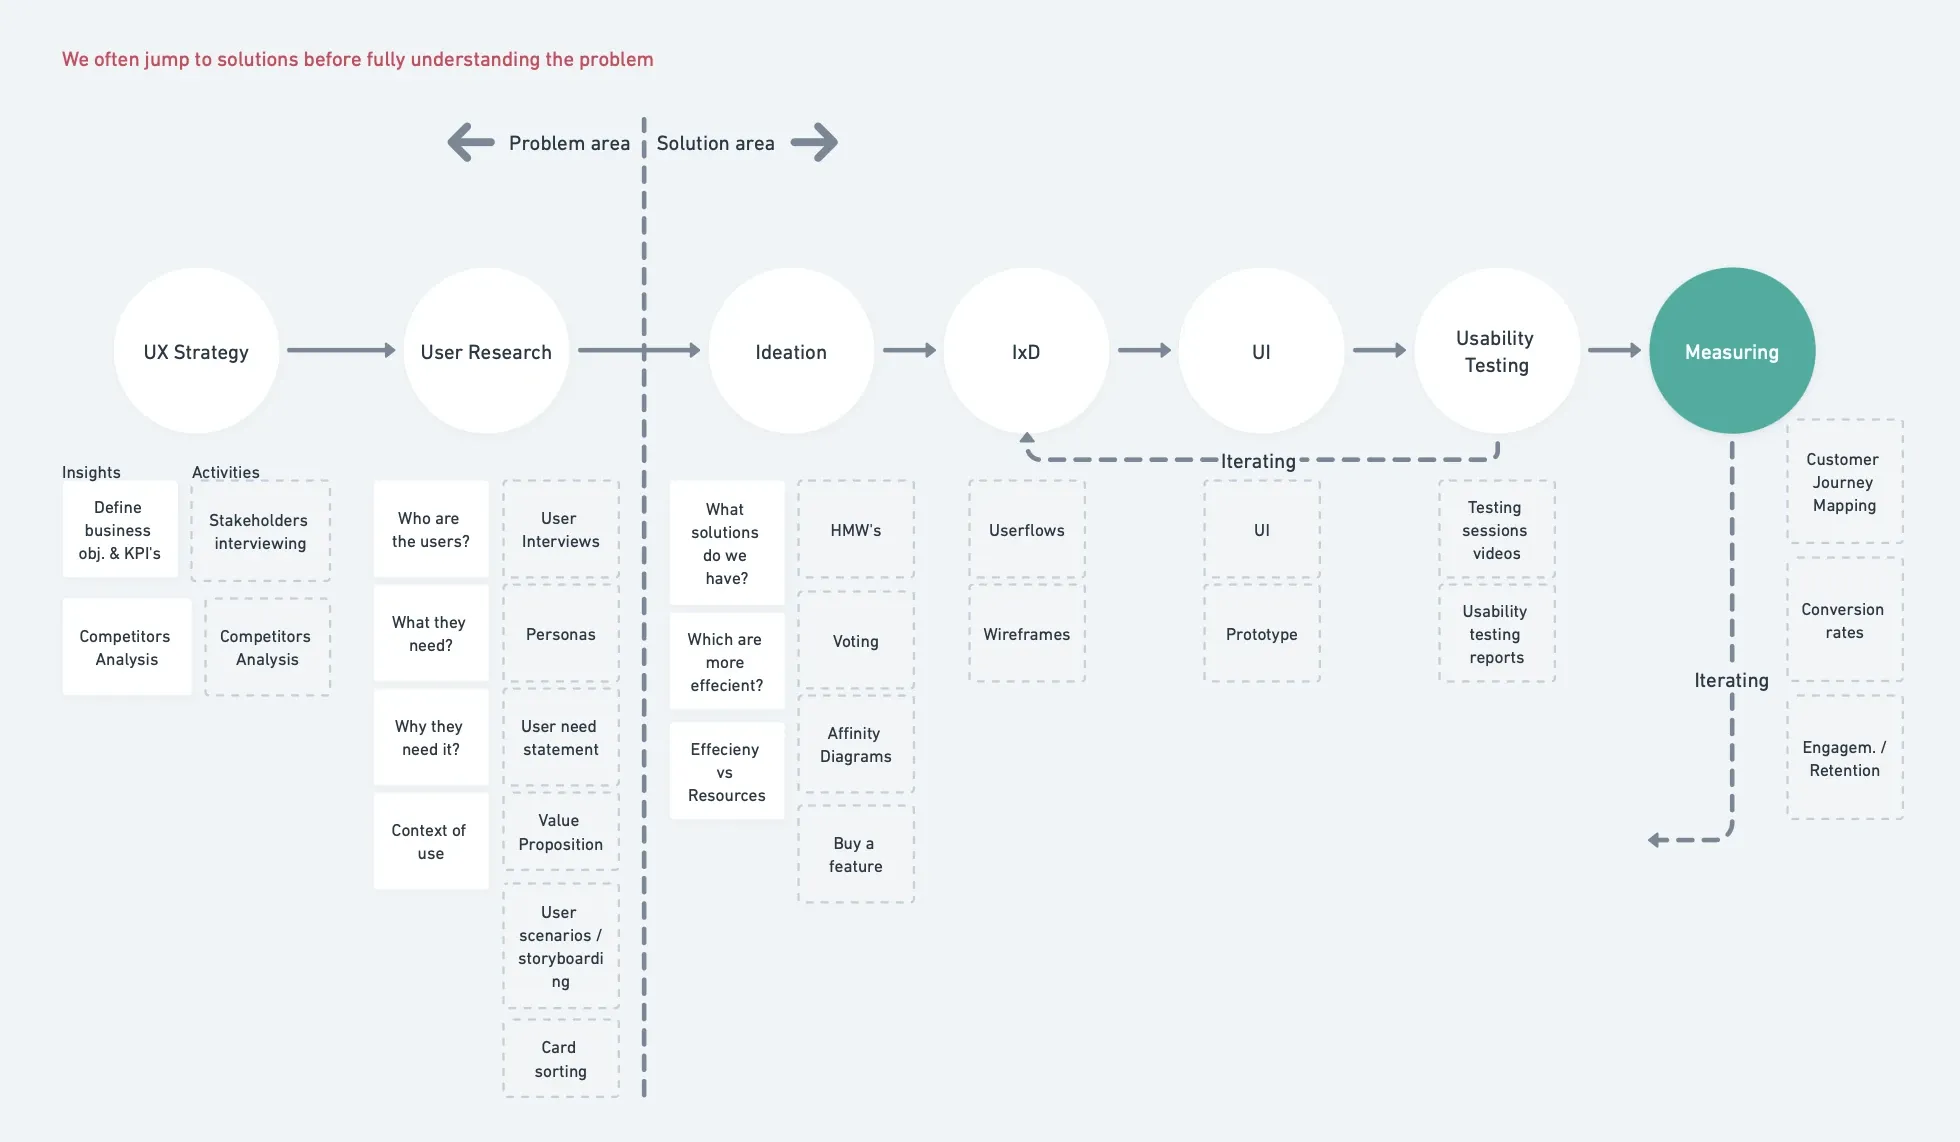
Approach
We mapped three solution paths against the variance problem.
Per-persona dashboards. One layout per underwriter type. Rejected as not scalable — every new persona meant a new layout, every new metric meant updating five layouts, and the design system would fragment within a release or two.
Adaptive monitoring. Watch what users actually clicked and reorder sections automatically over time. Acknowledged as the right end-state, tabled as the wrong shape for the engagement — it depended on telemetry infrastructure and behavior models that weren’t realistic to ship in the timeline.
Priority-driven personalization. A control that let underwriters rank the five signals — Neighborhood, Benchmarks, Value Estimate, Sales Comps, Tenant Credit — and have the dashboard reorder accordingly. This is what we sketched in the IA exploration as the “optimum” path.
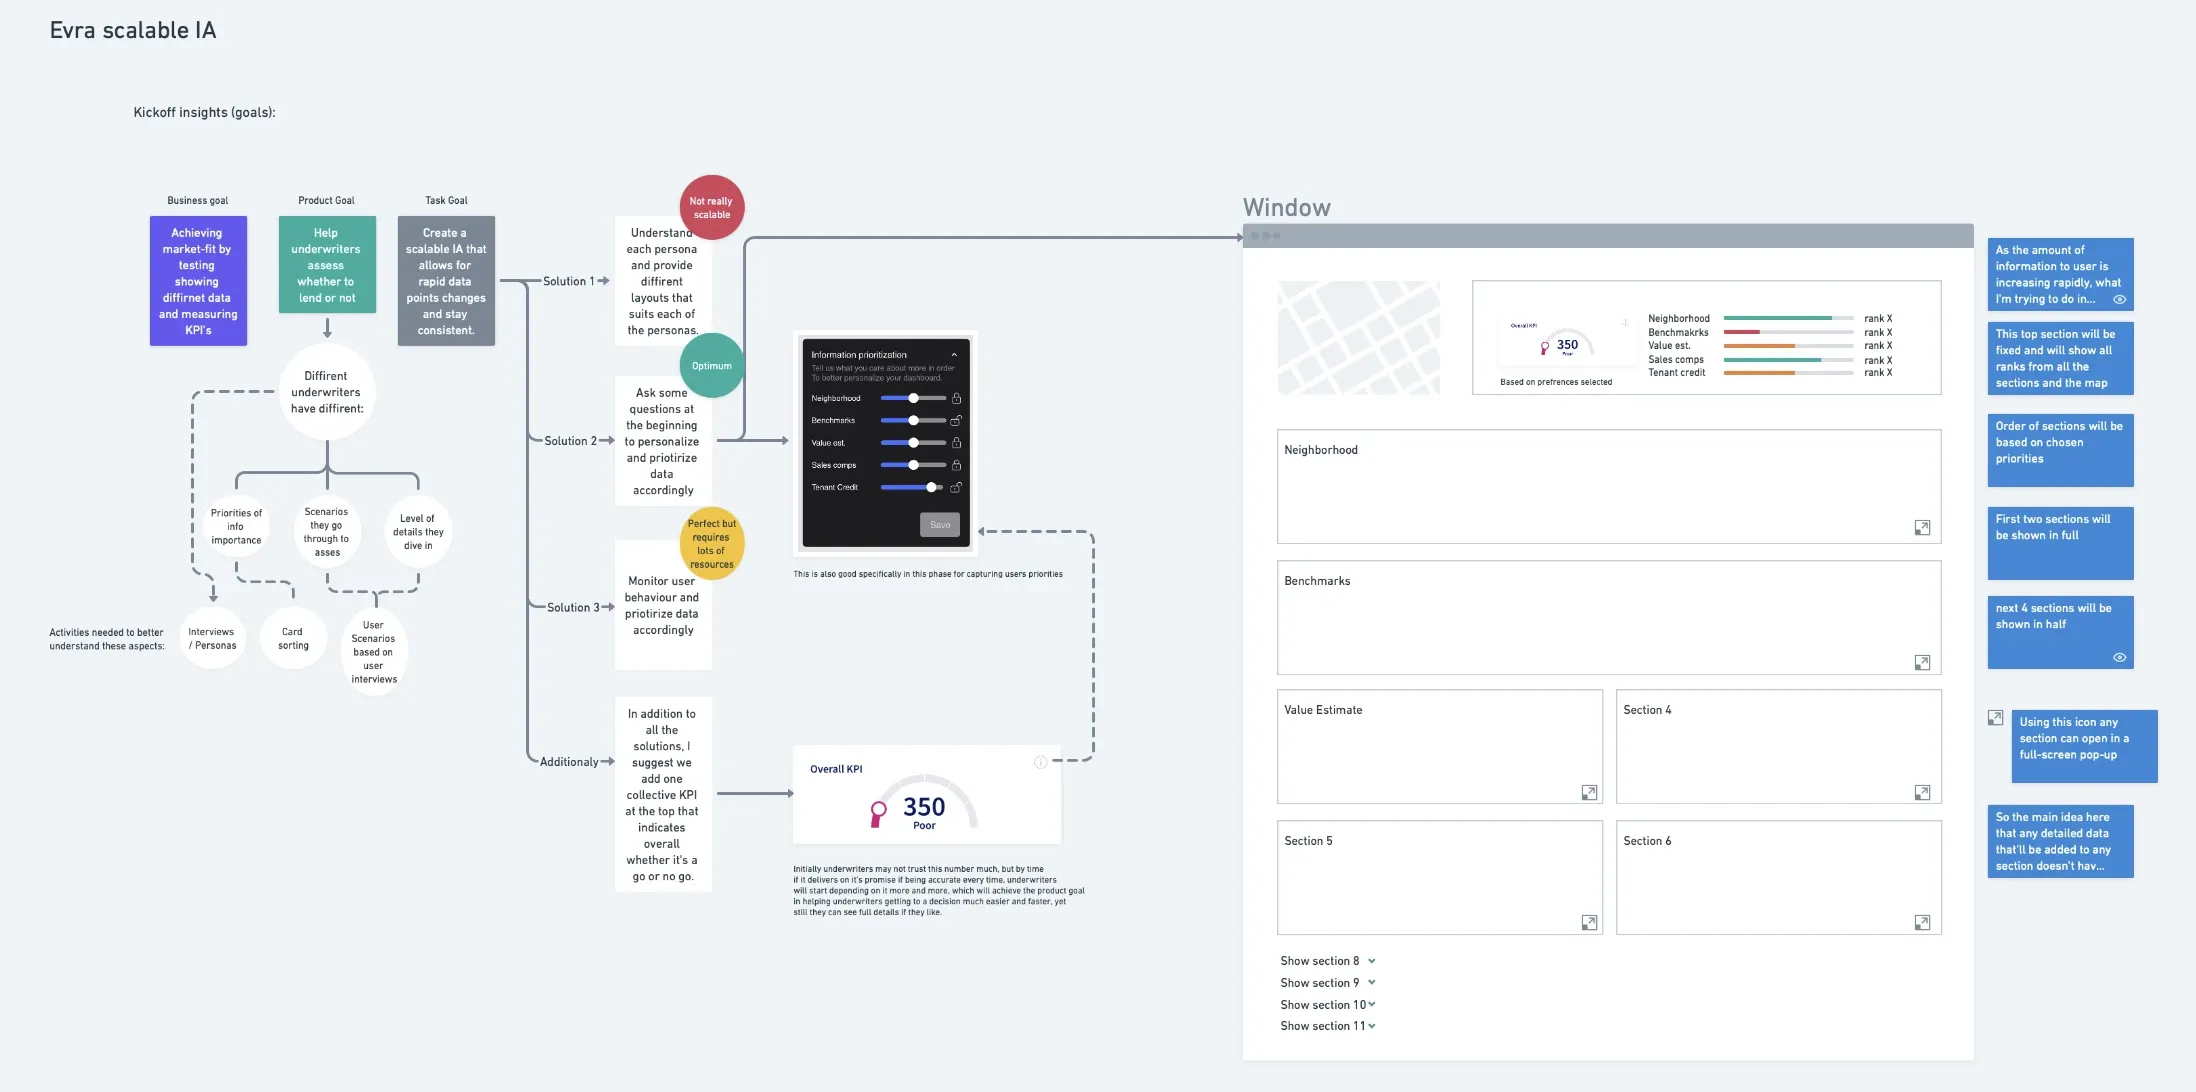
As we worked the IA, the third path quietly dissolved. Geophy’s data layer was already doing the prioritization work. The neighborhood ratings, the rank-against-metro values, the credit scores — these came from Geophy’s models aggregating public records, and the rankings were already context-sensitive to the property. The architecture didn’t need a control to let underwriters prioritize signals; it needed to make the model-derived signals legible enough that an underwriter could trust them on first read and verify them on second.
So the design move shifted. Instead of a personalization layer on top, we focused on linkage — making every number traceable to its underlying spatial and tabular evidence within two clicks.
Solution
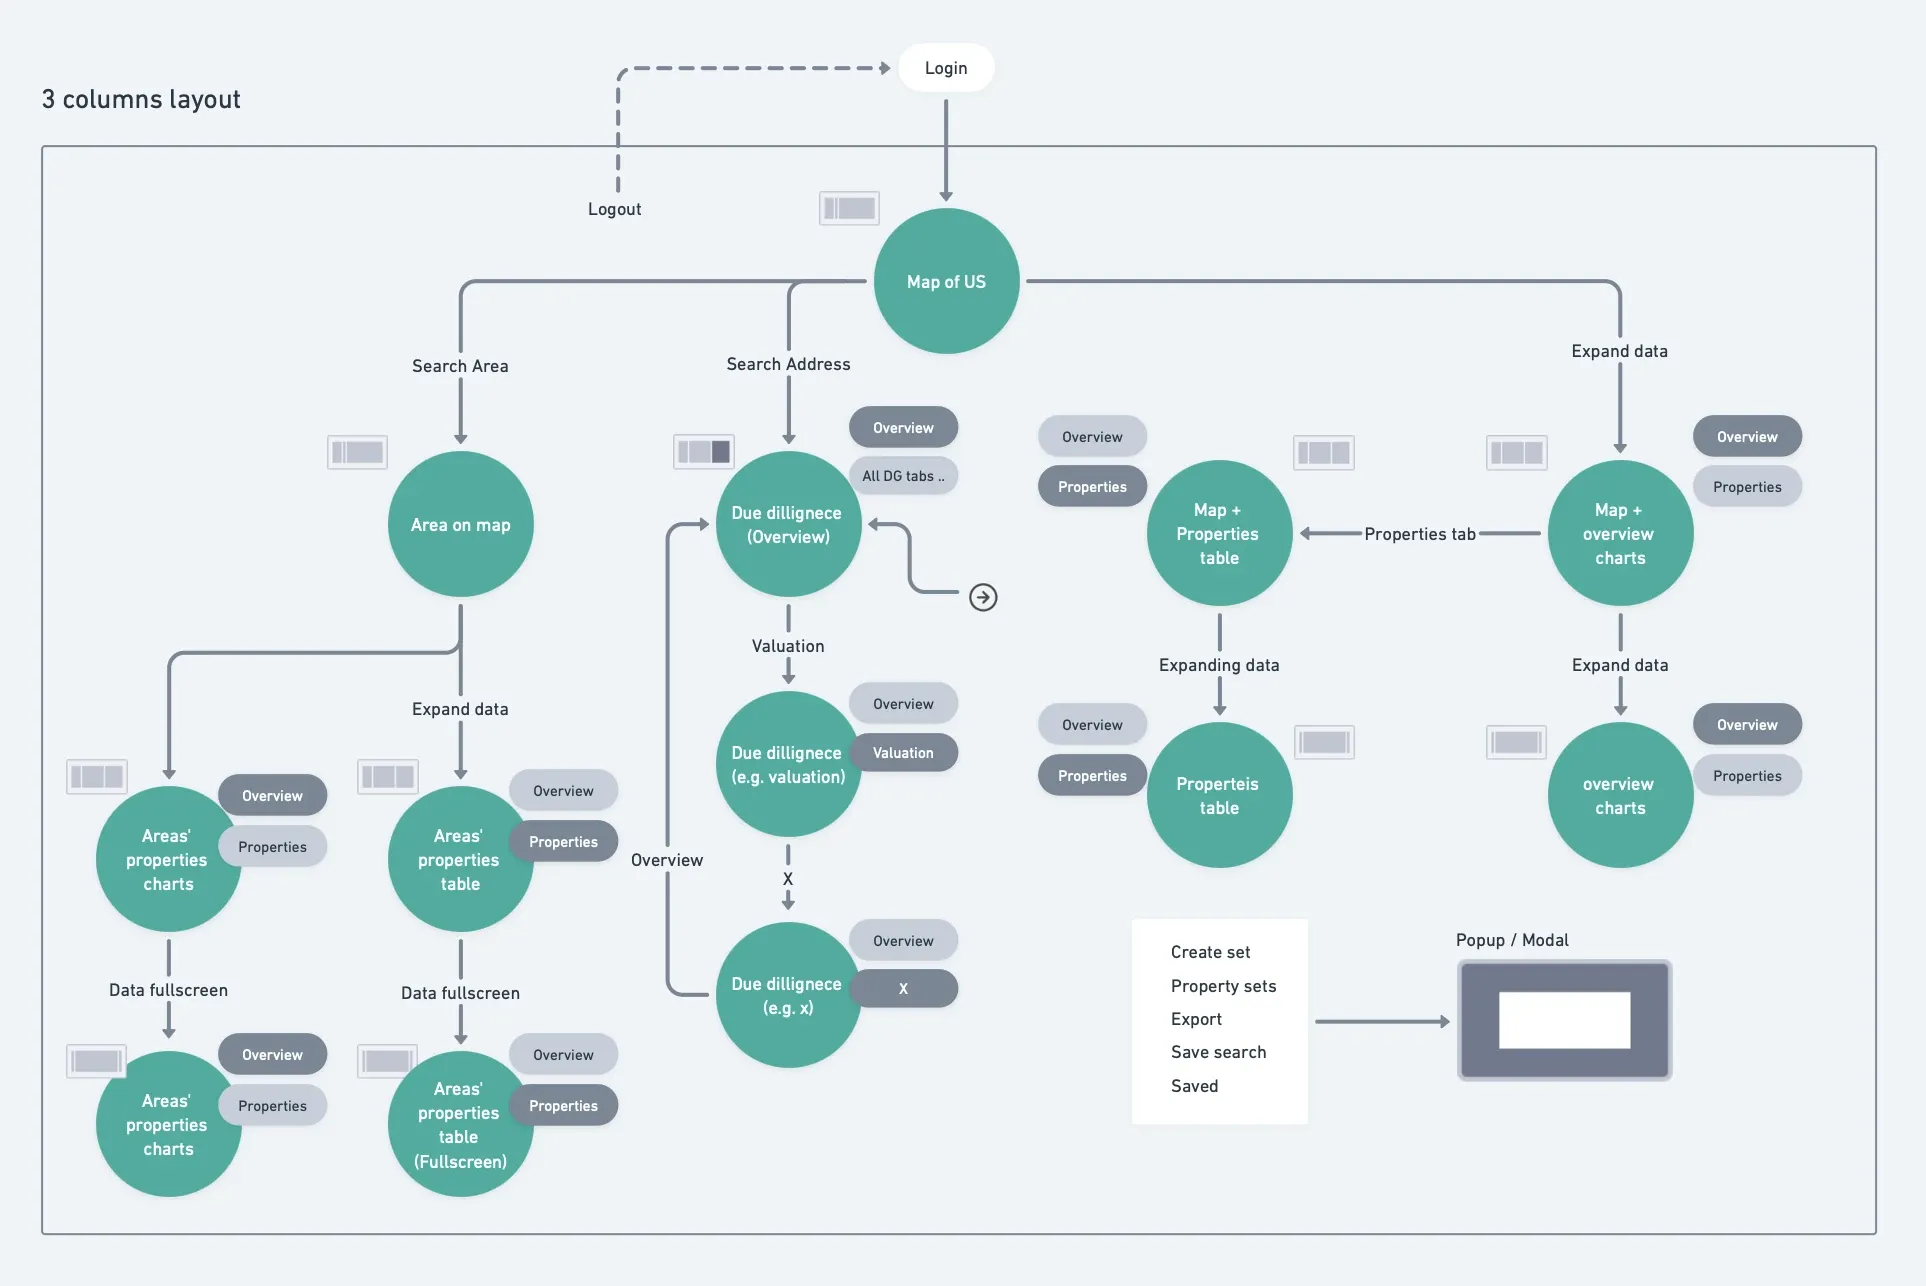
Evra shipped two surfaces tied to different underwriter modes.
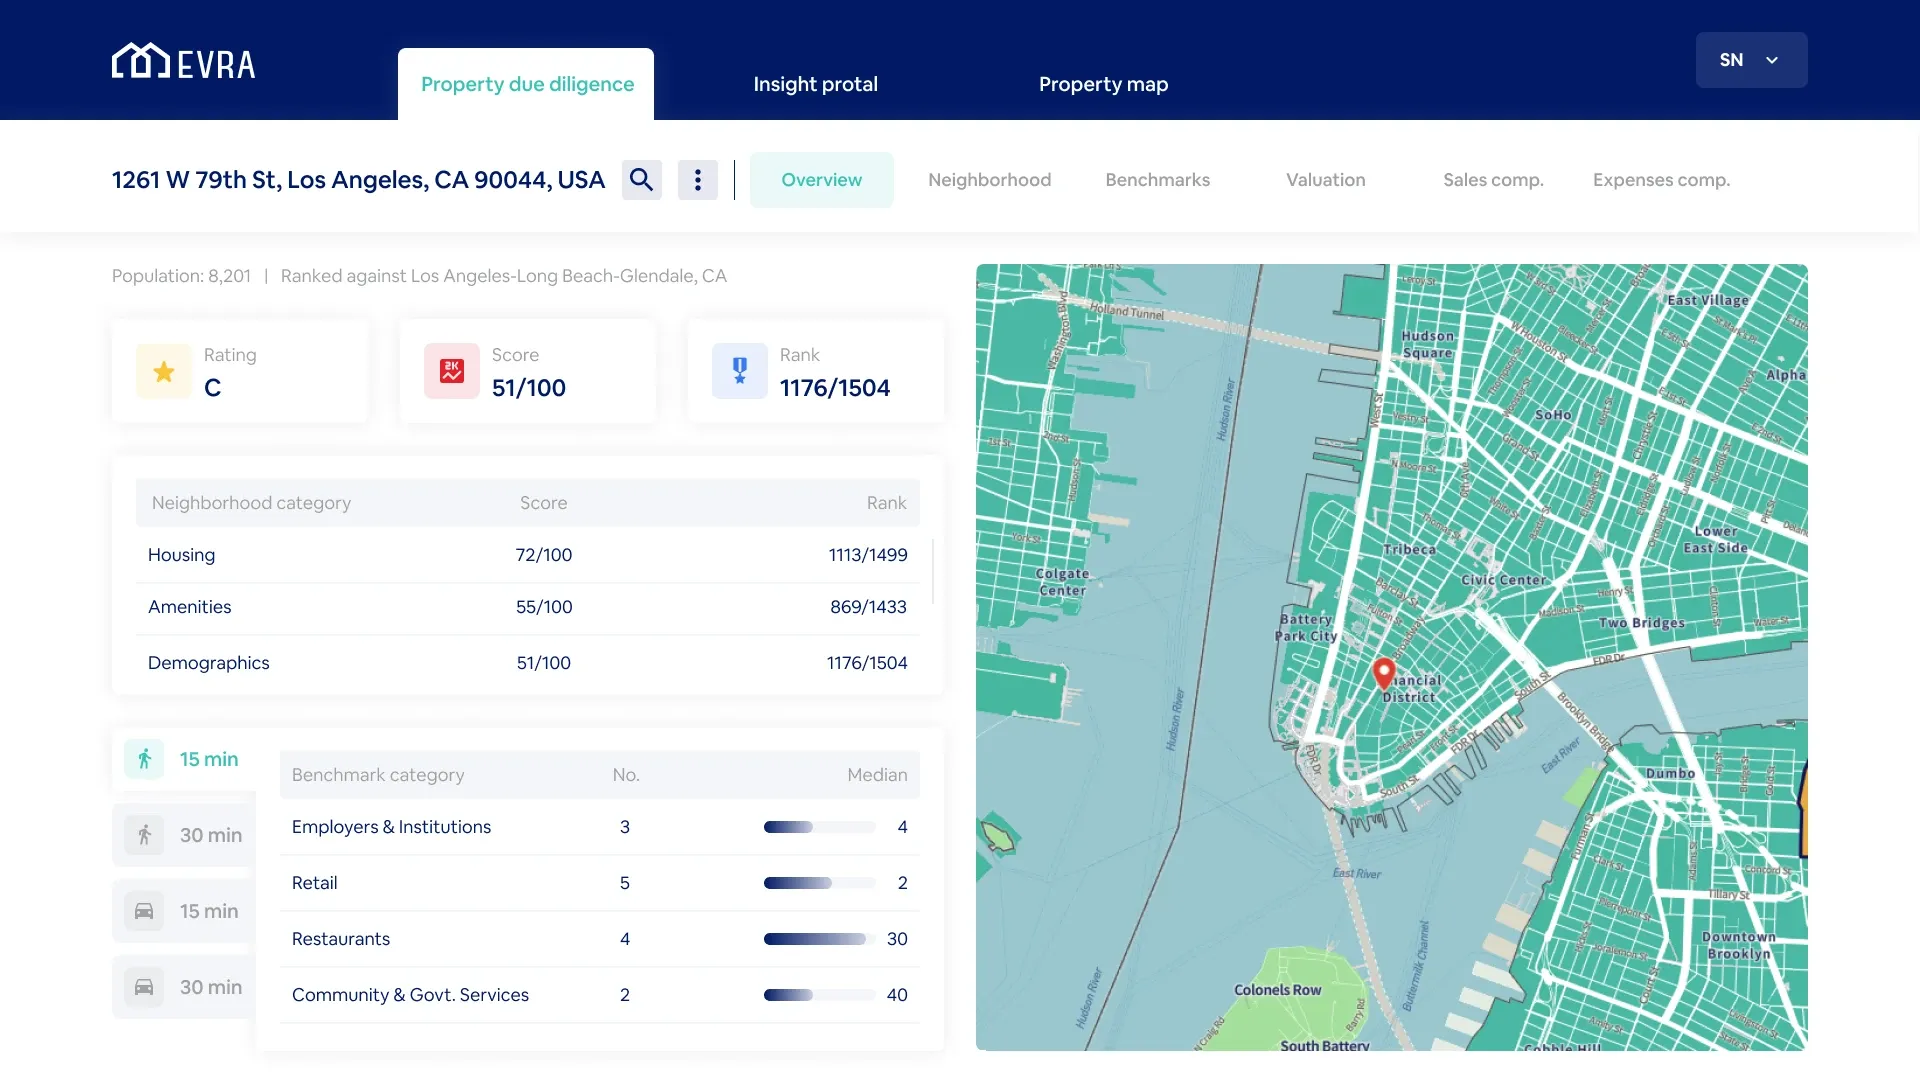
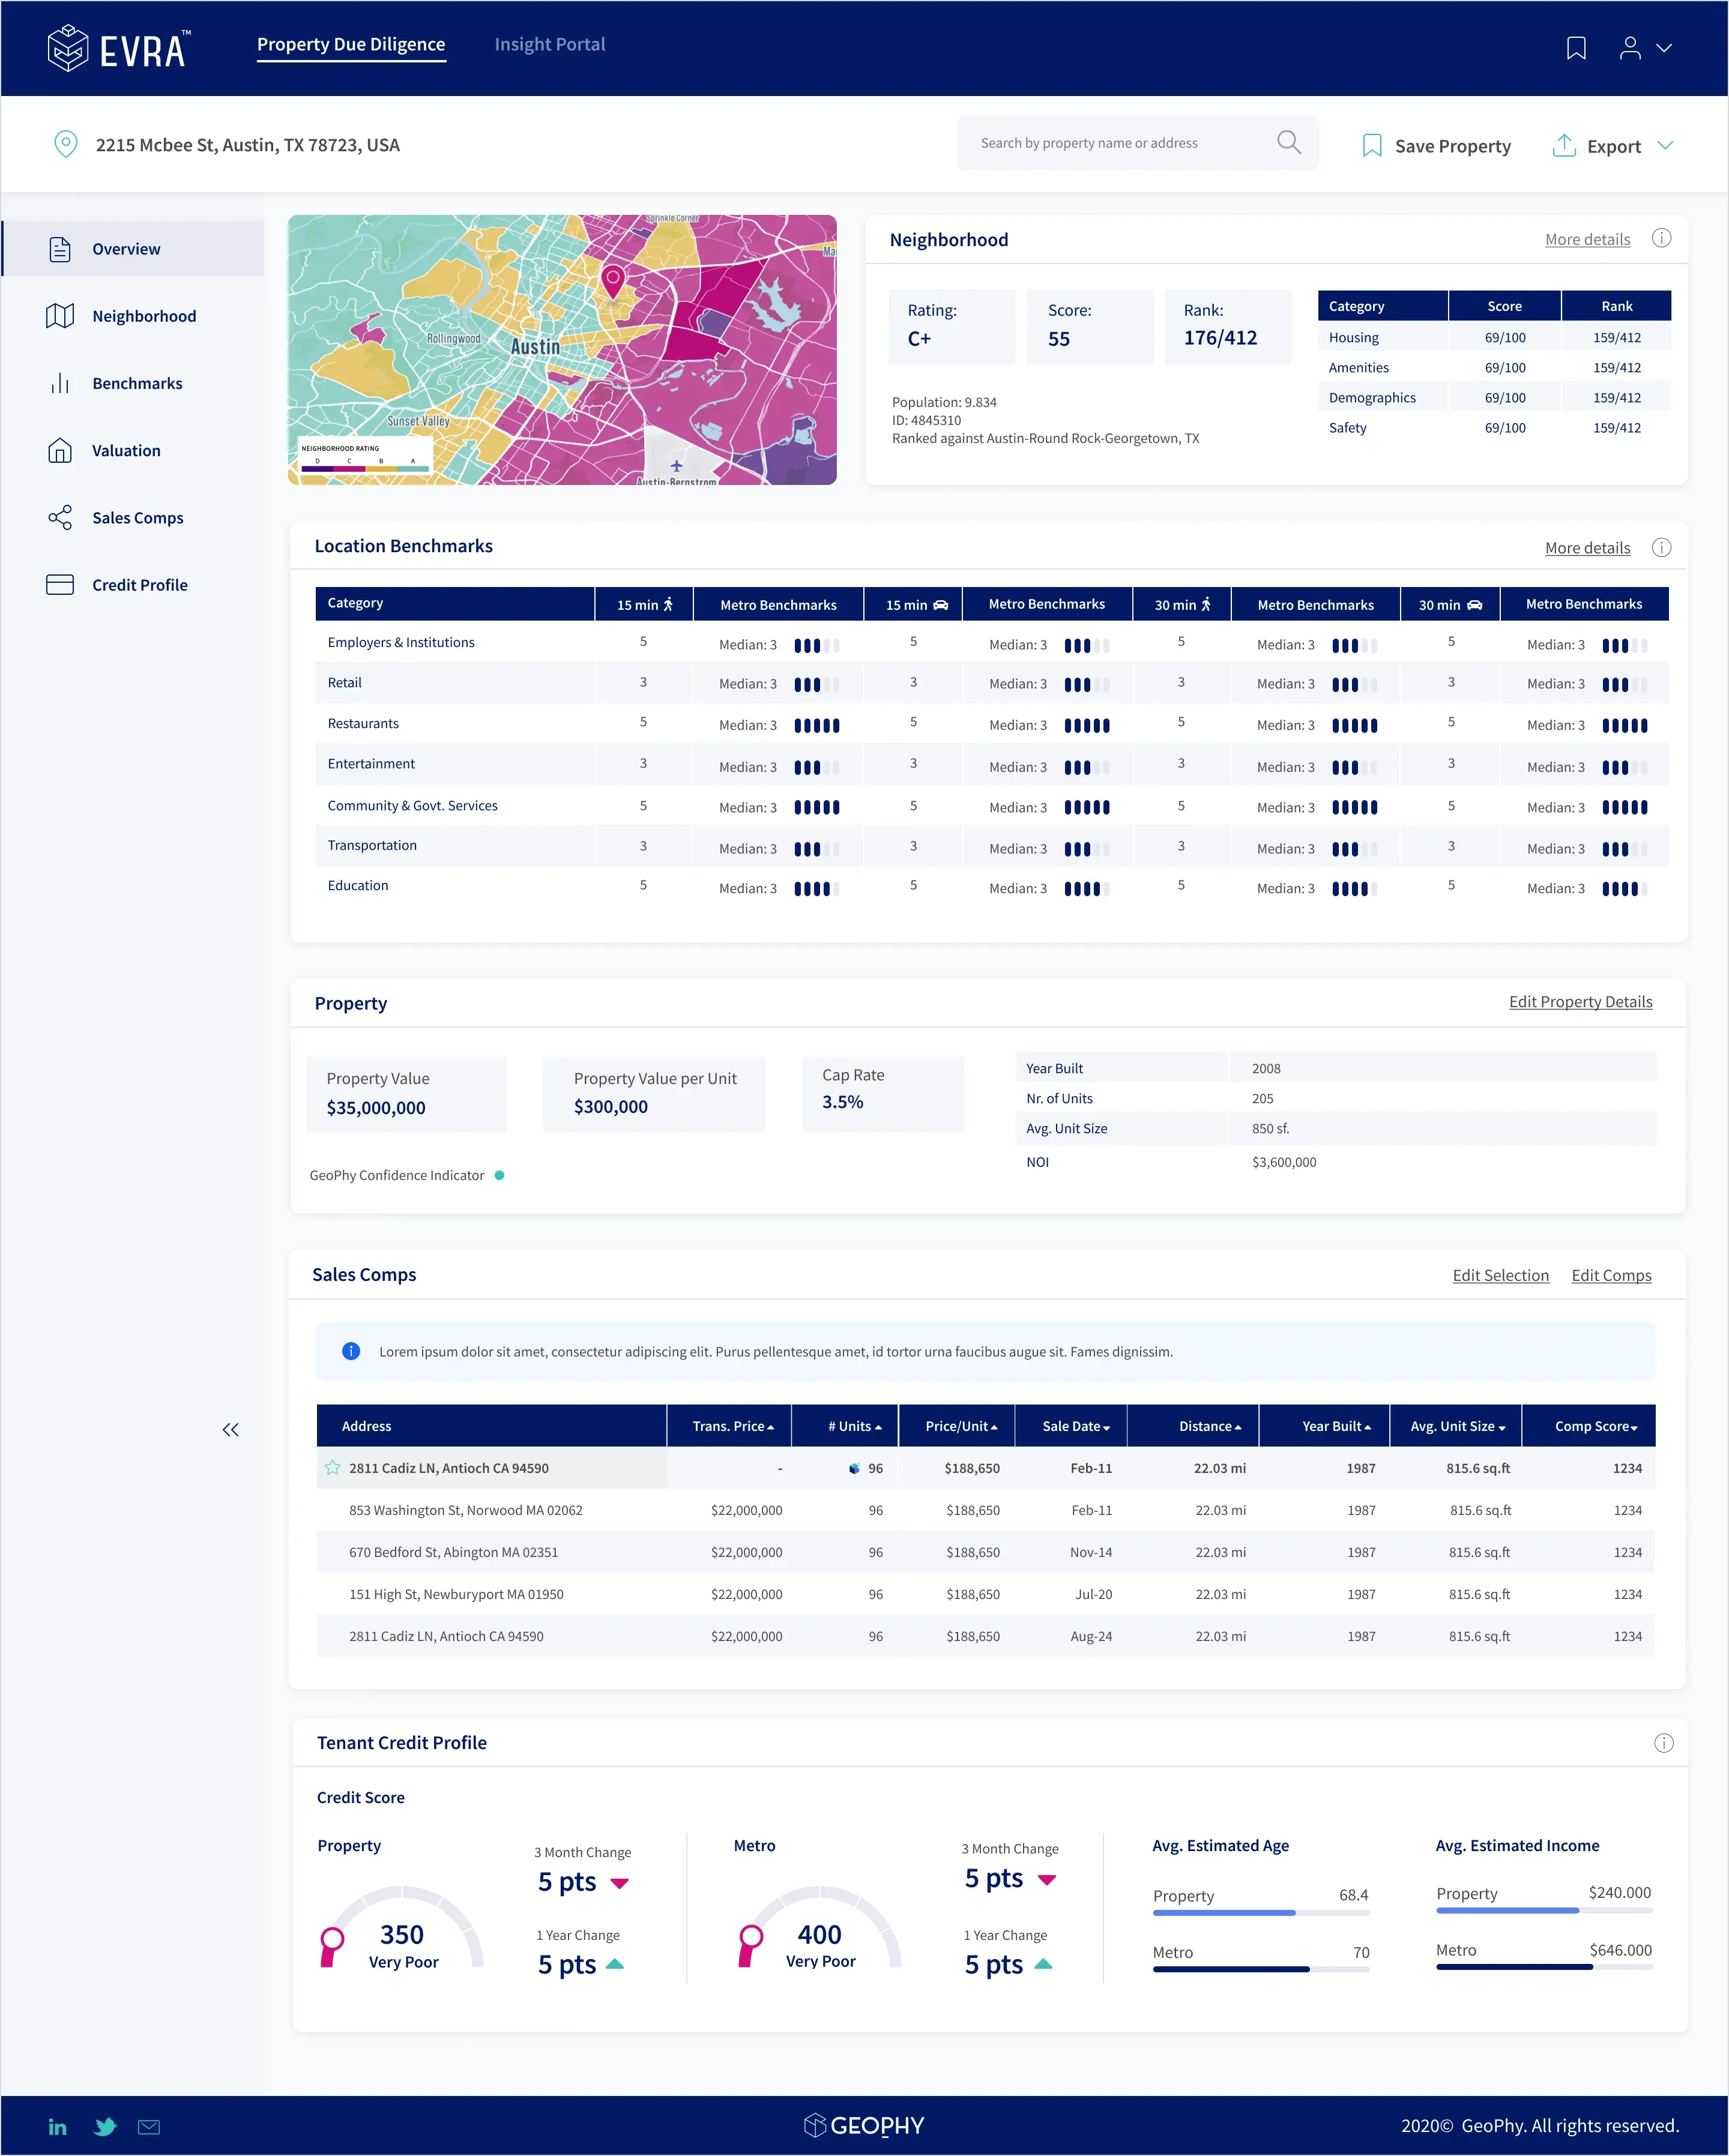
Property Due Diligence — single-property deep dive. Address in, full report out. Neighborhood, Benchmarks, Property Value, Sales Comps, and Credit Profile in a single scrollable view, each section offering a summary and an expand-to-detail. The C+ rating, the 176/412 rank, the $35M valuation — every headline number had a path to its source.
Property Map — multi-property exploration. A three-panel workspace (filters, table, map) with collapse modes for underwriters who wanted to focus on one side or the other. Filters narrowed the property set; the table held the data; the map held the geography; the three stayed linked.
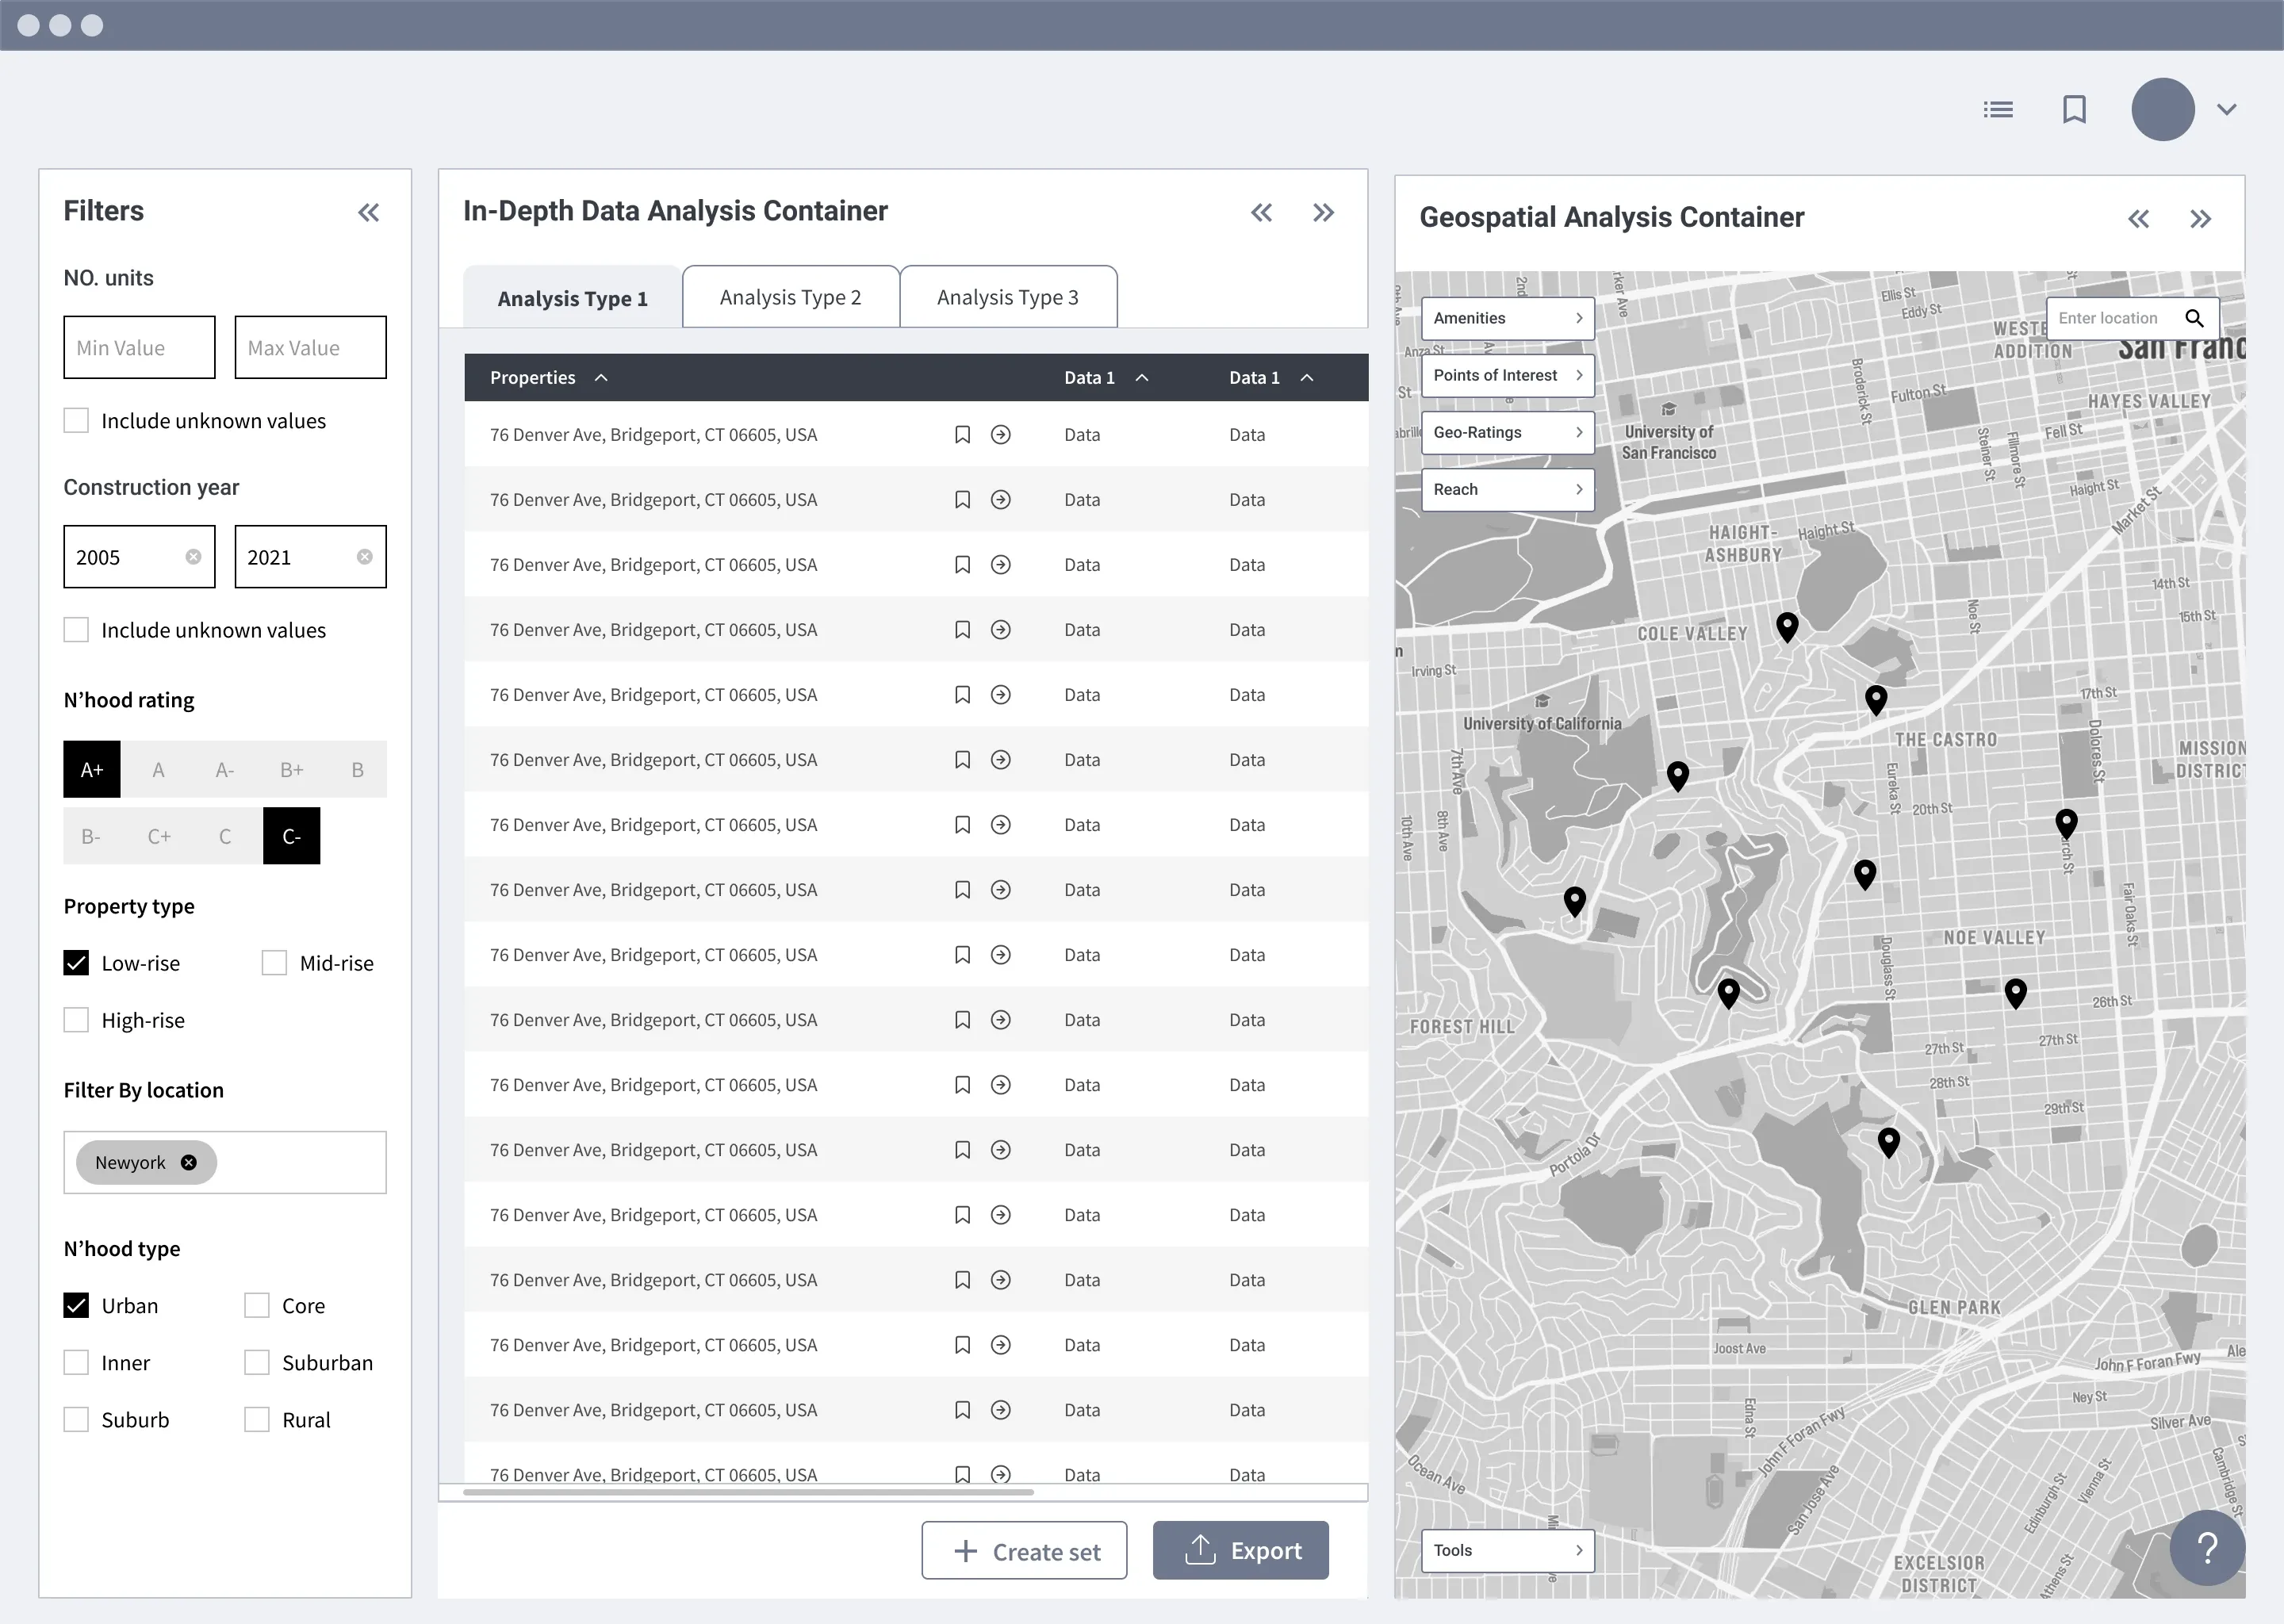
The signature interaction in the Property Map was map-as-evidence. Every metric in the data table could be visualized as a geographic overlay. Click the radio button next to Safety and the map rendered a safety gradient across the metro. Click Median Home Value and the map rendered the value distribution. Walk Reach and Drive Reach toggles overlaid isochrones from the property pin showing what was reachable in fifteen and thirty minutes on foot or by car.
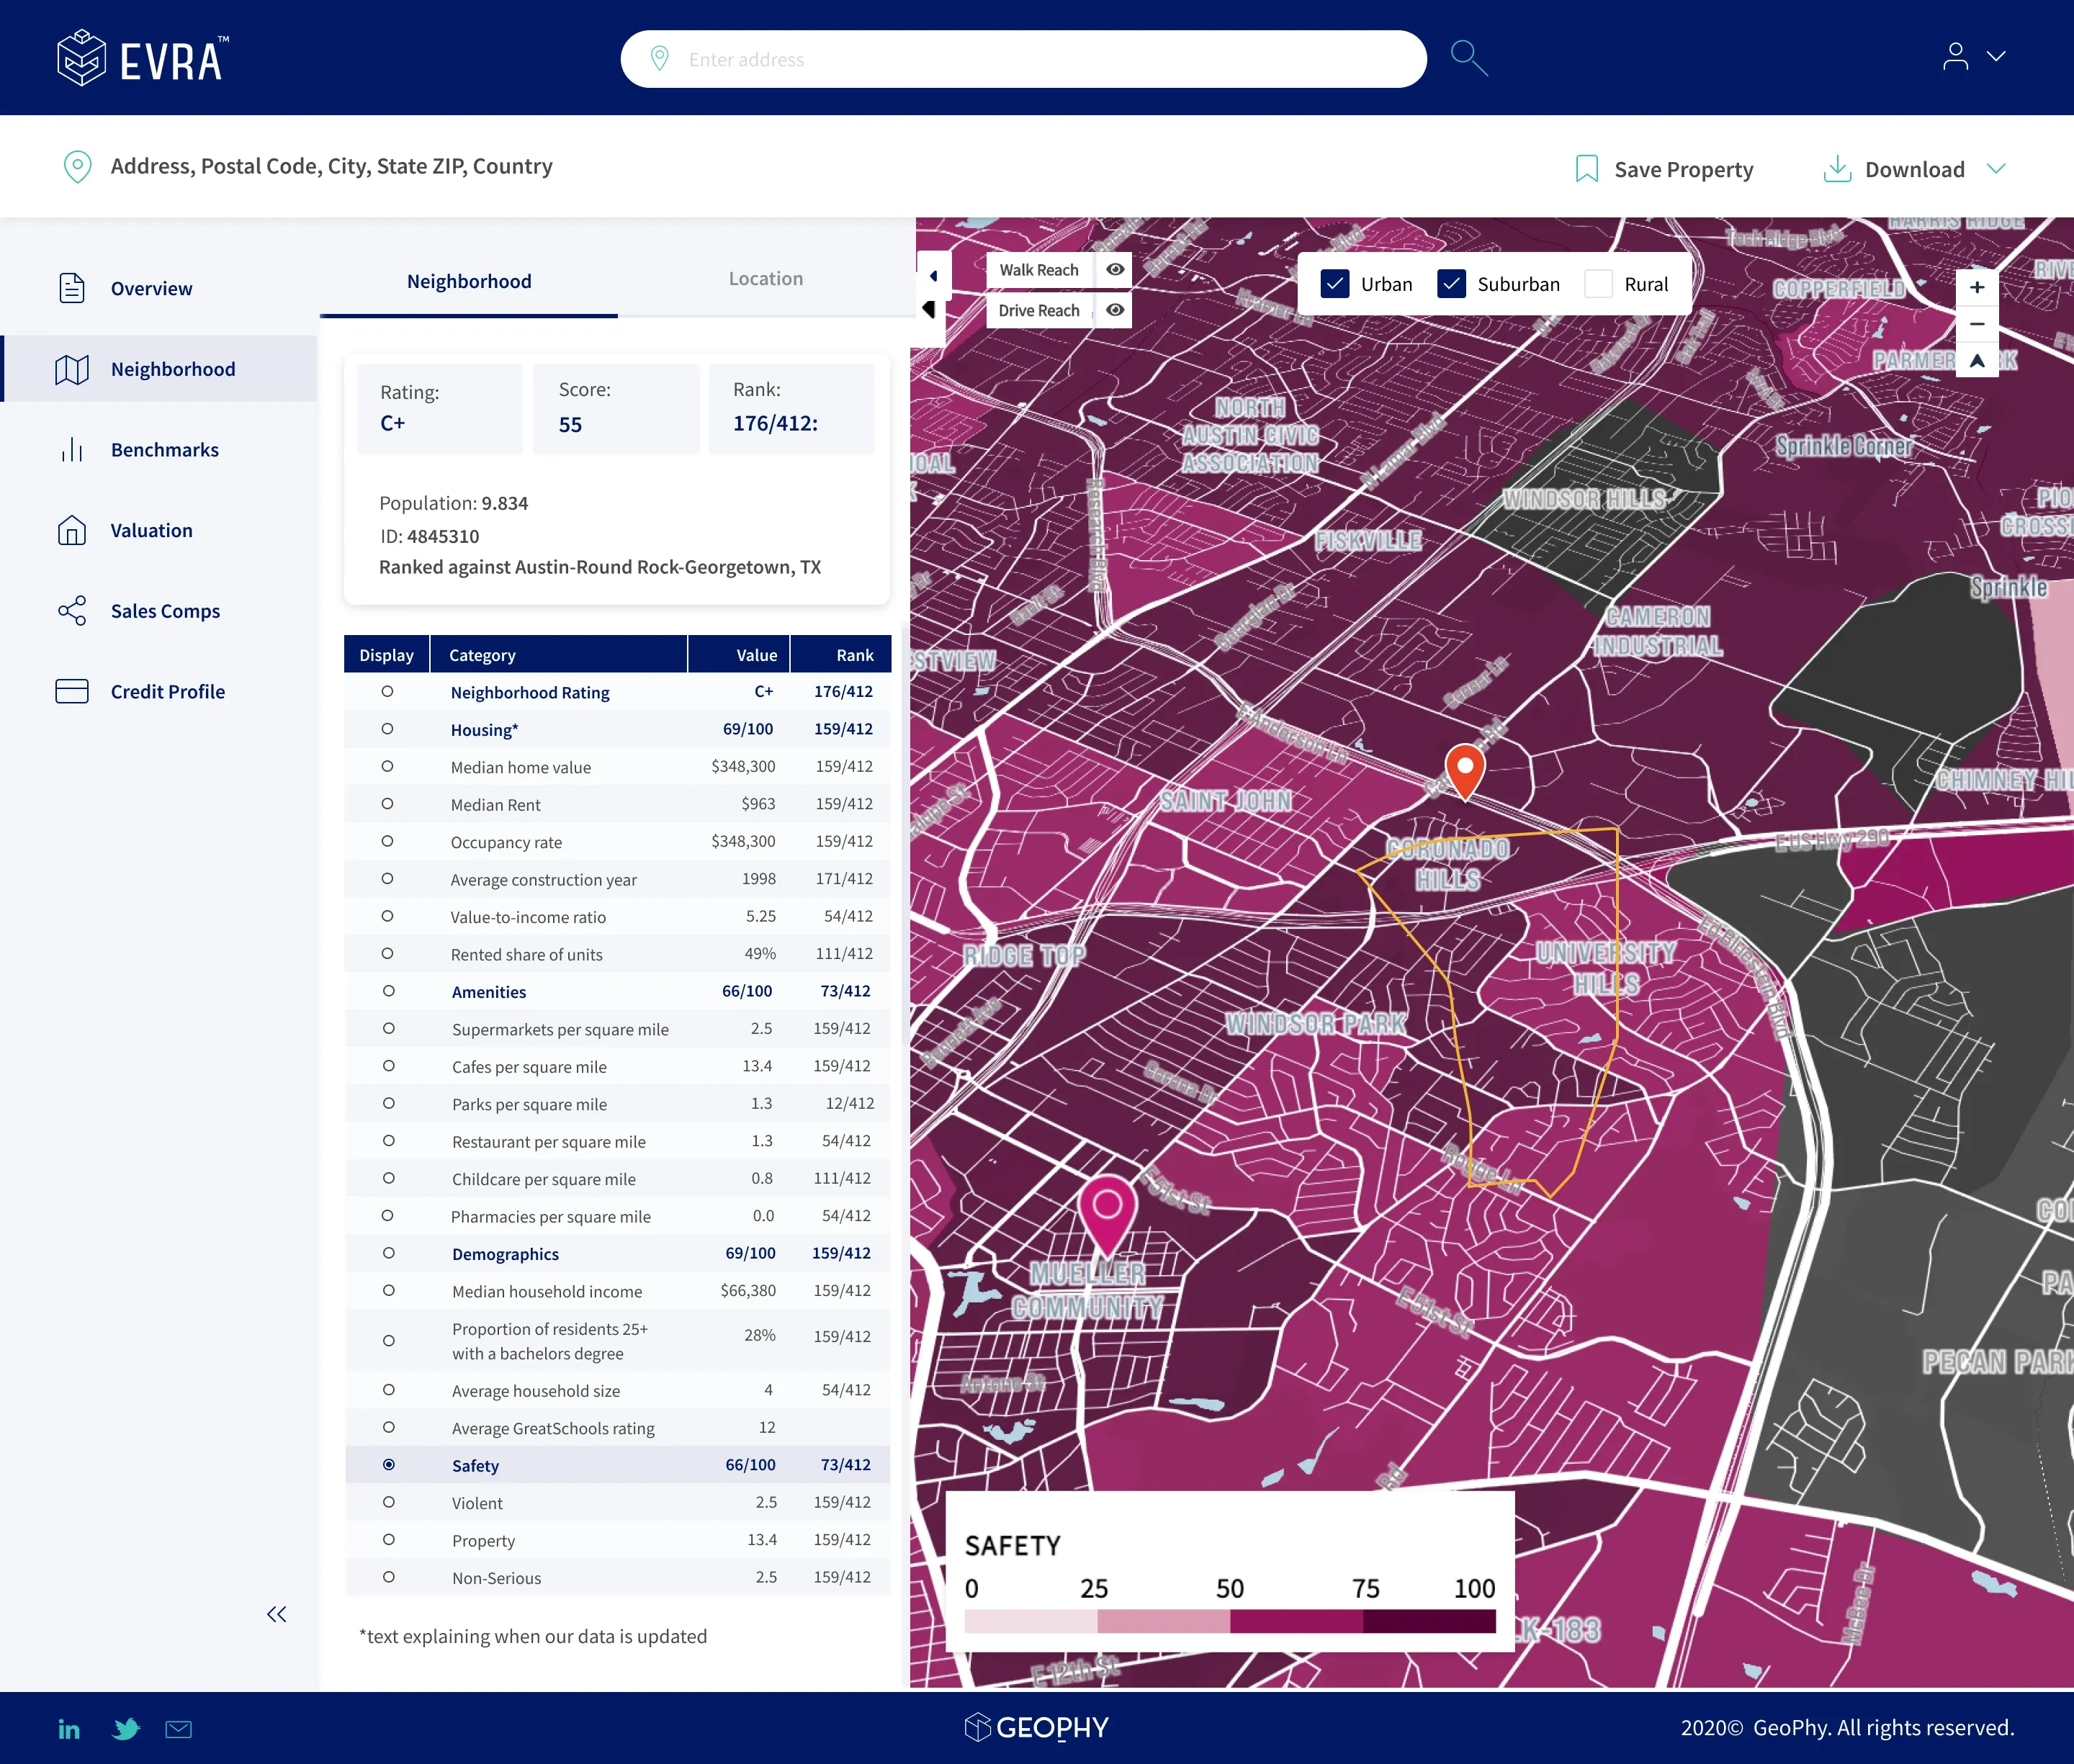
That last point was the trust mechanism for ML output. The valuation wasn’t an oracle; it was a summary of underlying spatial data, and any underwriter could drill from a number to its heatmap to its source data within two clicks. ML transparency wasn’t a confidence label bolted on the side — it was the map itself.
Outcome
Evra shipped both surfaces — Property Due Diligence and Property Map — organized around the map-as-evidence pattern. The information architecture stayed simple because the data layer was doing the personalization work the surface didn’t need to.
The pattern shaped how the team thought about ML transparency in adjacent products in the Geophy stack.
Geophy was acquired by Walker & Dunlop in 2022 for approximately $290M. Evra was one of several products in Geophy’s CRE intelligence stack at the time of the acquisition.
Reflection
The personalization problem in CRE looked like a surface problem at first. Three underwriters, three different reading orders — surely the dashboard needed a control. We ended up not building one, because the data layer was already doing the prioritization through model-derived rankings on aggregated public records. The personalization was happening below the UI.
The lesson I took: when you’re tempted to add a personalization control, check whether your data layer is already doing the work. Sometimes the right move is to make the data legible rather than the controls configurable.
ML trust isn’t a confidence label or a separate explainability page. It’s the ability to drill from a number into the data that produced it. In commercial real estate that data is geographic — so the map is the trust mechanism, not a sidebar bolted onto one.
medOne →
An EMR and practice management platform for US hospital systems, designed against the category's tradition of dense tables and one-size-fits-all chrome.